Command Query Responsibility Separation (CQRS) has become a popular pattern to avoid complex, and therefore slow, database queries in applications. With CQRS, queries are served from dedicated read models that are optimized for the query’s specific needs. This ensures that queries are as simple as possible, and therefore as fast as possible. The read models need to be initialized and kept up to date with the primary storage (the command side). This is done most easily if the primary storage is event-based: the Event Sourcing (ES) concept. Axon offers a mature and popular implementation of the CQRS/ES concepts on the JVM, but several other implementations exist.
CQRS/ES presents a solution to a common performance problem. On the other hand, it introduces a couple of new potential performance challenges. First, the event store may not be able to deal efficiently with the number of events being stored. If the events are kept in a regular relational database table, performance will severely degrade once it grows to the point where the indices can’t be buffered in RAM. This is when built-for-purpose event stores like Axon Server can come to the rescue.
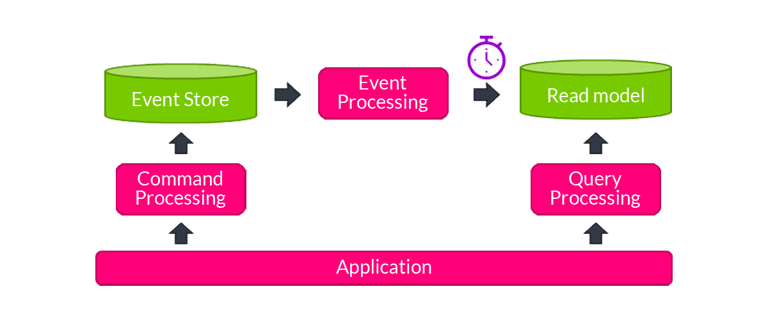
In this blog, we’ll discuss another performance challenge, related to the read models. Keeping read models up to date is usually not a challenge, as they are simple and don’t require any business logic checking. But when we introduce a new read model or change an existing one, we suddenly need to initialize it by replaying past events and doing the corresponding updates to the read model. This may easily become a challenge. For example, if we have a history of 1 billion events, and the associated read model updates can be performed at a rate of 1000/second, then the replay would take more than 11 days. That would be unacceptable in most cases. So let’s look at how to optimize this process.
Our test case
To do some benchmarking, we implemented a small sample application in Axon 4. It has a command model describing bank accounts, which can be opened, credited, debited, and closed. We defined a read model that keeps track of all open bank accounts with their current balance. We created a test set of 10 million events, constructed in such a way that at any point in time at most 1 million open bank accounts existed.
We implemented the read model both in Postgres (9.6) and in Mongo (3.6). The event processor logic and the read model database were each running on 8 vCPU / 30G machines (Ubuntu 18.10), with the read model database having a 1TB SSD (all provisioned on Google Cloud Platform). In this setup, we could start measuring at what rate we can replay the 10 million events into our read model.
As a scope limitation, our tests were focused on projecting to a single database server. Sharding across multiple servers could be used to increase throughput beyond our present results.
An initial attempt
The first attempt at a read model was simply using JPA to create/update/delete records in Postgres. Handlers look like this:
@EventHandler
public void on(AccountCreditedEvt evt) {
    entityManager.find(AccountSummary.class, evt.getAccountId())
                 .setBalance(evt.getNewBalance());
}
We kept all Axon configuration default. Functionally, this is fine. Performance-wise, this is horrible. We measured a processing rate of just 260 events per second. Even a 10 million event store (which isn’t that big) would take more than 10 hours to process. Clearly, this needs to be improved!
Setting the batch size
Axon processes events in batches. In addition to the handling of the individual events, Axon performs the following work for each batch:
- It needs to update the tracking token (typically also kept in the read model database) to remember its position in the event stream.
- When using a transactional store, it begins and commits a database transaction.
The default batch size in Axon is 1. Compared to the work that has to be done per event (just inserting, updating, or deleting a single record), the above presents a lot of overhead. It is, therefore, reasonable to expect that we might benefit from a larger batch size. Axon’s TrackingEventProcessorConfiguration allows us to set that. The benchmark results are plotted below (note the logarithmic horizontal axis):
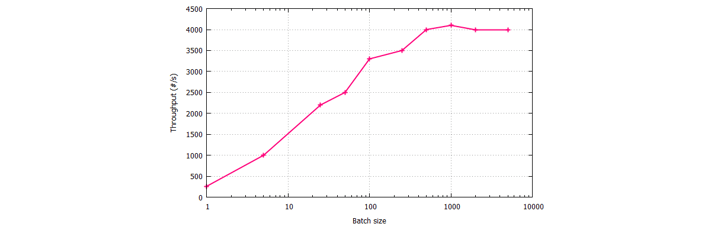
The results are pretty clear: increasing the batch size from 1 to 500 takes us from 260 events per second to about 4k events per second – a 15-fold improvement. But, increasing it any further doesn’t provide additional benefits, so if we want to go beyond the 4k we need to find additional tricks.
When using batched processing, you need to be aware of the following when using a non-transactional read model: when processing fails mid-batch, the tracking token won’t be updated and all the events in the batch will be processed again in the next attempt, including the ones that were already processed. It’s advisable to make all projection methods idempotent to deal with this correctly.
Parallel processing
By default, Axon uses a single thread for event processing, but just like batch size, this can be configured differently. Sticking with a batch size of 500, the results when going from 1 to 8 threads are plotted below:
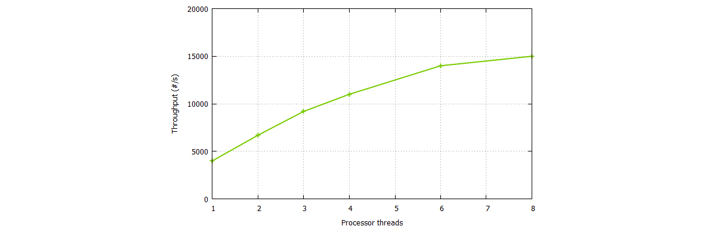
Like in the case of increasing the batch size, there are some big initial gains, but as we add more threads, returns are diminishing. We ended up doing about 15k events per second, nearly 4 times our single-threaded rate, and more than 55 times the rate of our first attempt.
Please be aware that parallel event processing is not trivial. When events get processed on different threads, they may also get processed out of order. That may lead to problems. If the event stream would lead to an INSERT and later an UPDATE on the same record, then multi-threaded processing might lead to an UPDATE before the INSERT, which would fail. Axon deals with this problem by having a configurable sequencing policy that determines which events must be guaranteed to be processed in order, on the same threads. The default sequencing policy is that events belonging to the same aggregate must be processed on the same threads, which works fine for our case.
Batch optimization
When using JPA to update our read model in batches, we get a number of optimizations automatically. Thanks to the notion of JPA “managed entities”, two updates on the same record in a batch will be performed by one read and one update, instead of two reads and two updates. And if multiple INSERTs take place consecutively (without UPDATEs in between), it will probably do a multiple-record INSERT as an optimization.
In reality, our read model allows for a number of other optimizations, which our JPA model wouldn’t be able to know about automatically:
- If we want to UPDATE the balance of a bank account, there’s really no need to read the bank account record before doing the update. We can issue the UPDATE directly. This is one less statement, but more importantly, one less round-trip to the database.
- We can consolidate the effect of all the events in the batch that are related to the same aggregate to a single INSERT, UPDATE or DELETE for that aggregate. After that, we are completely free to reorder these operations, which means we can consolidate them into bulk statements.
The downside of these optimizations is that these are not just configuration changes. This requires specific coding in our event handlers and is domain-dependent. The good thing here is that Axon does offer the APIs needed to implement this cleanly. For each batch, there will be a single UnitOfWork. This object can be injected into our event handler methods, by simply adding it as a parameter. It has a ConcurrentHashMap-style ‘getOrComputeResource’ method that allows us to attach other resources to the UnitOfWork. Using this approach, we can do processing at the end of the batch to implement the above-mentioned optimizations.
Using this technique, our throughput doubled from 15k events per second to 30k events per second. We’re now at 115 times the throughput we started with. For 10 million events, that’s from more than 10 hours to under 6 minutes. Of course, whether this last step is worth the effort is very much dependent on your exact use case. Also, at these types of rates, the speed at which Axon can read the events from the event store may actually become the bottleneck.
Mongo instead of Postgres
All the results discussed above have been measured on Postgres. For comparison, we created the same read model on Mongo. Using again a batch size of 500 and 8 processor threads, we measured the following:
- 12k events per second in the non-batch optimized approach
- 22k events per second using simple batch optimization with Spring Data Mongo
- 30k events per second using fully optimized batching directly on the Mongo driver
This is very similar to the Postgres measurements.
Conclusion
As we’ve seen, using some simple and some not-so-simple tricks, replay performance can be enhanced dramatically. This can easily make the difference between replays-being-unfeasible and replays-being-feasible.
You can download open source Axon here.